Portfolio
There are myriad complex issues facing people today. Yet, data, in responsible hands, offers a solution to everything from cybersecurity to social (in)justice. That is why I initially pursued the M.S. in Data Analytics and Policy program at Johns Hopkins: to do my part in solving contemporary issues in a way that is evidence-based and equitable. 🏫
Take a look below at some of the work I completed during the program. 💪
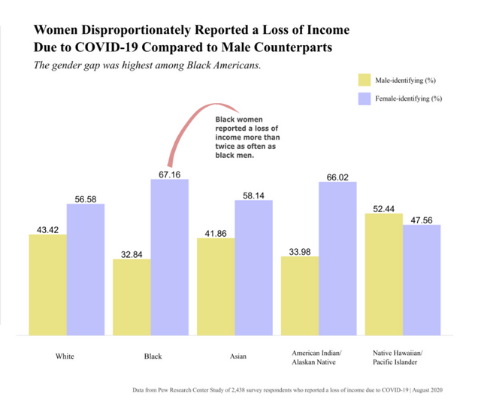
The Unequal Consequences of COVID-19
RShiny Dashboard

For this Data Visualization project, I created an RShiny dashboard demonstrating the unequal consequences of COVID-19.
Skills: R, RShiny, regression, ggplot2, tidyverse, packcircles, HTML, plotly, gganimate, dplyr, Inkscape, data wrangling
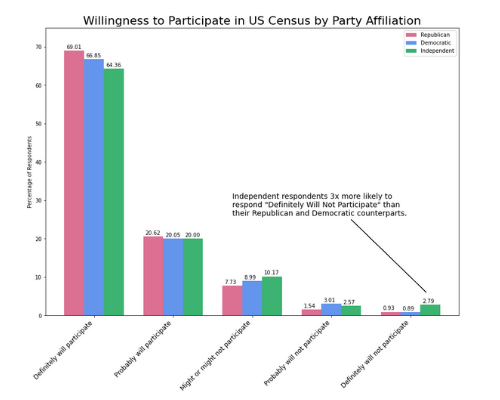
Willingness to Participate in US Census by Party Affiliation

In this analysis I used Python to quantify the relationship between an individual's willingness to participate in the United States Census and their political party affiliation.
Skills: Python, Jupyter Notebook, statistical analysis, regression, scikit-learn, matplotlib, Pandas, NumPy, seaborn, HTML, Javascript
Personal Website

For this project, I decied to create this website from scratch instead of using a template from a site like SquareSpace. I decided to create a website on my own to become more savvy in web development and styling languages.
Skills: Python, HTML, CSS, Javascript, web development
United States Cities K-Means Clusters Based on City Health Data

In this project, I used a dataset from the City Health Dashboard to cluster United States cities into clusters using K-Means.
Skills: R, K-Means, tidyverse, dendexend, factoextra
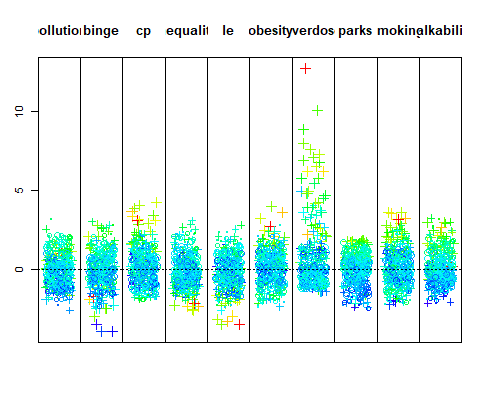
Outlier Detection

Here I used outlier detection methods to identify outliers within a dataset.
Skills: R, statistical analysis, tidyverse, mvoutlier, ggplot2, mahalonobis
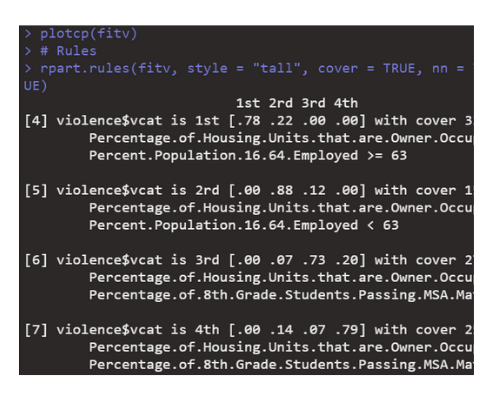
Predicting Crime in Baltimore With Feature Engineering

In this project, I feature engineerd a "violent crime" index based on several demographics in Baltimore. Next, I used this model to predict crime from 2010 to 2015, and tested the validity of the model.
Skills: R, tidyverse, skimr, pastecs, rpart, rattle, data wrangling, feature engineering, prediction, decision trees